> ## Documentation Index
> Fetch the complete documentation index at: https://docs.tablepro.app/llms.txt
> Use this file to discover all available pages before exploring further.
# Server Dashboard
> Monitor active sessions, server metrics, and slow queries in real time
# Server Dashboard
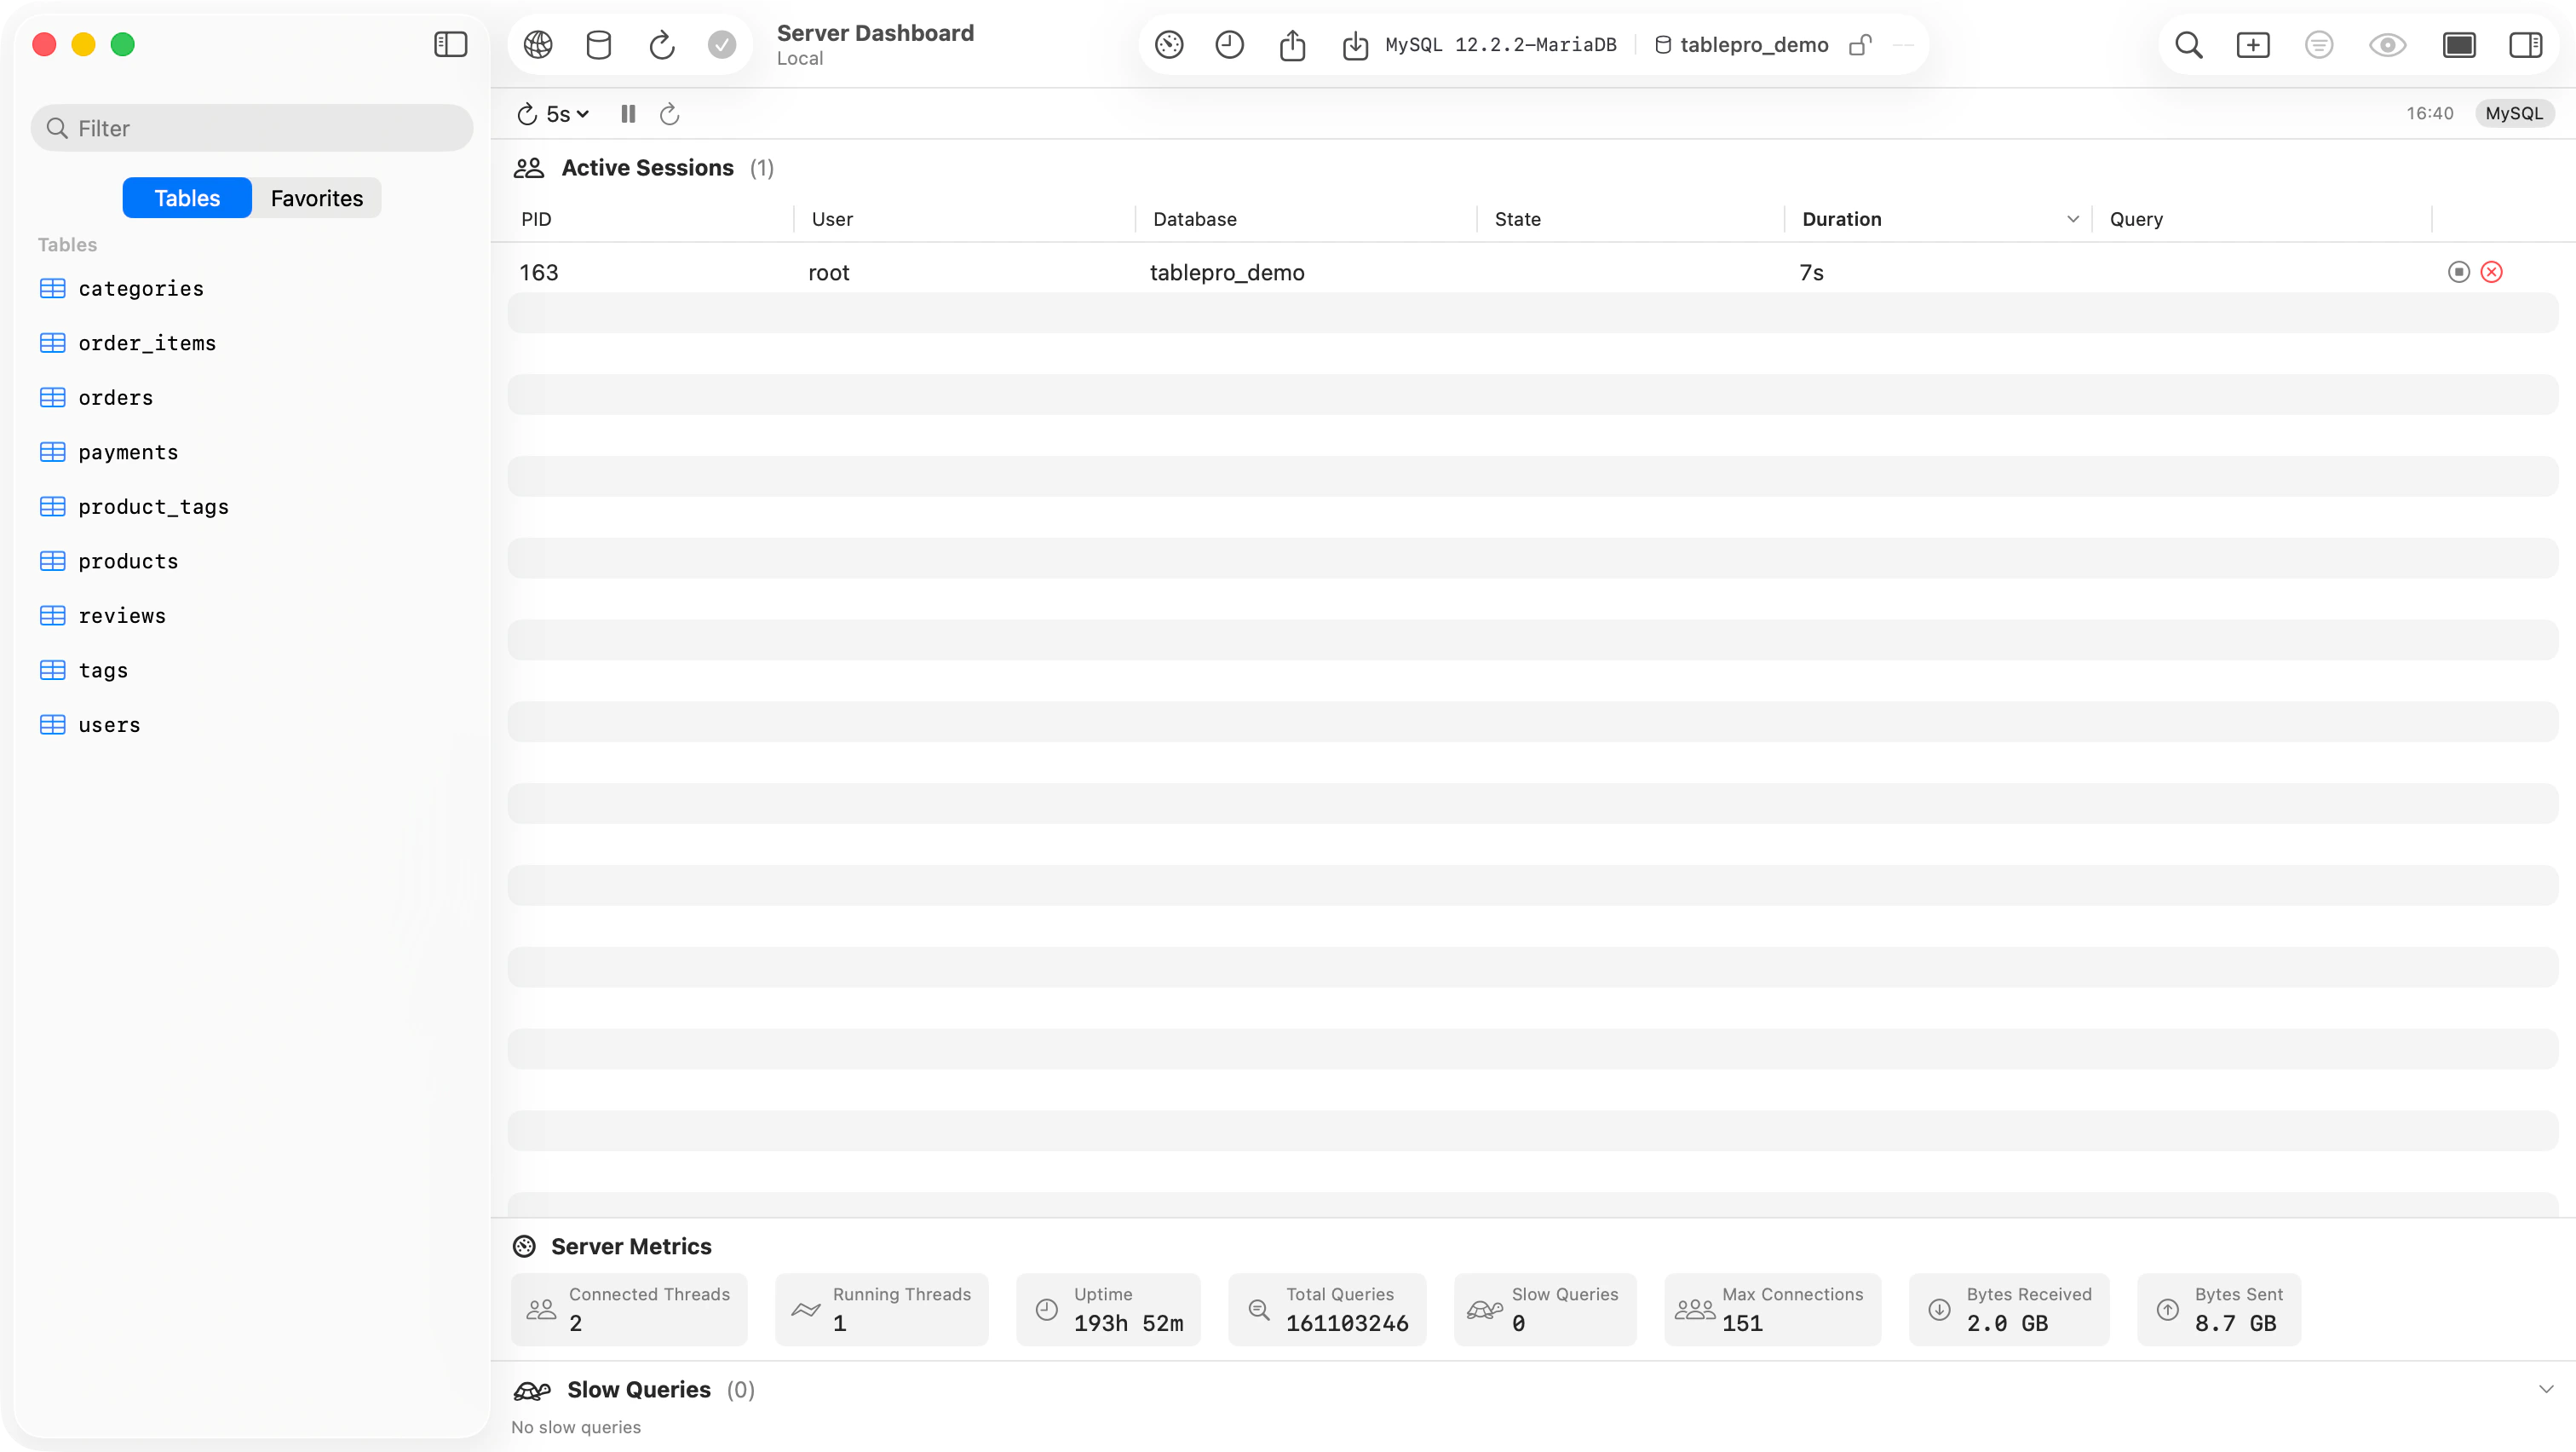
The dashboard shows active sessions, key server metrics, and slow-running queries with configurable auto-refresh.
Open it from the menu bar **View > Server Dashboard**. A Dashboard toolbar button is also available: right-click the toolbar, choose **Customize Toolbar**, and drag it in.
 ## Active Sessions
A sortable table of all connections to the server, showing:
* **PID** - process or session ID
* **User** - connected user
* **Database** - target database
* **State** - current status (active, idle, sleeping)
* **Duration** - how long the current operation has been running
* **Query** - the SQL statement being executed (truncated, hover for full text)
### Kill and Cancel
Each session row has action buttons:
* **Cancel Query** (stop icon) - cancels the running query without terminating the connection (`pg_cancel_backend` on PostgreSQL, `KILL QUERY` on MySQL)
* **Terminate Session** (x icon) - kills the entire connection
Both actions show a confirmation alert before executing. If the server rejects the action, an Action Failed alert shows the error.
## Server Metrics
A horizontal strip of metric cards. What is shown depends on the database:
| Database | Metrics shown |
| ----------------------------------- | -------------------------------------------------------------------------------------------------------------------- |
| PostgreSQL / Redshift / CockroachDB | Connections, cache hit ratio, database size, uptime, active queries |
| MySQL / MariaDB | Connected threads, running threads, uptime, total queries, slow queries, max connections, bytes received, bytes sent |
| MSSQL | User sessions, uptime, database size |
| ClickHouse | Active queries, active merges, part mutations, disk usage |
| DuckDB | Database size, block size, total blocks, memory limit, threads |
| SQLite | Database size, page count, page size, journal mode, cache size |
## Slow Queries
A list of queries running longer than 1 second, sorted by duration. Each entry shows the elapsed time, SQL text, user, and database.
The dashboard panels sit in a vertical split. Drag the dividers between Active Sessions, Server Metrics, and Slow Queries to resize each section; positions are remembered across launches.
## Auto-refresh
The dashboard toolbar provides refresh controls:
* **Interval picker** - choose 1s, 2s, 5s (default), 10s, 30s, or Off
* **Pause/Resume** - temporarily stop refreshing without changing the interval (disabled when the interval is Off)
* **Refresh Now** - runs a manual refresh
* **Last refresh time** - shown on the right
## Database Support
| Database | Sessions | Metrics | Slow Queries | Kill | Cancel |
| ----------------------------------- | :------: | :-----: | :----------: | :--: | :----: |
| PostgreSQL / Redshift / CockroachDB | Yes | Yes | Yes | Yes | Yes |
| MySQL / MariaDB | Yes | Yes | Yes | Yes | Yes |
| MSSQL | Yes | Yes | Yes | Yes | - |
| ClickHouse | Yes | Yes | Yes | Yes | - |
| DuckDB | - | Yes | - | - | - |
| SQLite | - | Yes | - | - | - |
For databases without a dashboard provider (Redis, MongoDB, and others), the menu item and toolbar button are disabled.
## Active Sessions
A sortable table of all connections to the server, showing:
* **PID** - process or session ID
* **User** - connected user
* **Database** - target database
* **State** - current status (active, idle, sleeping)
* **Duration** - how long the current operation has been running
* **Query** - the SQL statement being executed (truncated, hover for full text)
### Kill and Cancel
Each session row has action buttons:
* **Cancel Query** (stop icon) - cancels the running query without terminating the connection (`pg_cancel_backend` on PostgreSQL, `KILL QUERY` on MySQL)
* **Terminate Session** (x icon) - kills the entire connection
Both actions show a confirmation alert before executing. If the server rejects the action, an Action Failed alert shows the error.
## Server Metrics
A horizontal strip of metric cards. What is shown depends on the database:
| Database | Metrics shown |
| ----------------------------------- | -------------------------------------------------------------------------------------------------------------------- |
| PostgreSQL / Redshift / CockroachDB | Connections, cache hit ratio, database size, uptime, active queries |
| MySQL / MariaDB | Connected threads, running threads, uptime, total queries, slow queries, max connections, bytes received, bytes sent |
| MSSQL | User sessions, uptime, database size |
| ClickHouse | Active queries, active merges, part mutations, disk usage |
| DuckDB | Database size, block size, total blocks, memory limit, threads |
| SQLite | Database size, page count, page size, journal mode, cache size |
## Slow Queries
A list of queries running longer than 1 second, sorted by duration. Each entry shows the elapsed time, SQL text, user, and database.
The dashboard panels sit in a vertical split. Drag the dividers between Active Sessions, Server Metrics, and Slow Queries to resize each section; positions are remembered across launches.
## Auto-refresh
The dashboard toolbar provides refresh controls:
* **Interval picker** - choose 1s, 2s, 5s (default), 10s, 30s, or Off
* **Pause/Resume** - temporarily stop refreshing without changing the interval (disabled when the interval is Off)
* **Refresh Now** - runs a manual refresh
* **Last refresh time** - shown on the right
## Database Support
| Database | Sessions | Metrics | Slow Queries | Kill | Cancel |
| ----------------------------------- | :------: | :-----: | :----------: | :--: | :----: |
| PostgreSQL / Redshift / CockroachDB | Yes | Yes | Yes | Yes | Yes |
| MySQL / MariaDB | Yes | Yes | Yes | Yes | Yes |
| MSSQL | Yes | Yes | Yes | Yes | - |
| ClickHouse | Yes | Yes | Yes | Yes | - |
| DuckDB | - | Yes | - | - | - |
| SQLite | - | Yes | - | - | - |
For databases without a dashboard provider (Redis, MongoDB, and others), the menu item and toolbar button are disabled.